top of page

Team
Yirang Choe, Aravind Jembu Rajkumar, Jashan Gupta, Modassir Iqbal, Monikka Ravichandran, Natalie Yeh
Timeline
September 2019 - May 2020 (8 months)
My Role
UX Research, Mid-fi & Hi-fi Prototyping, and Design Documentation
Tools
Figma, Miro Board, Adobe XD, and Zeplin
Project Overview
Our capstone project team was commissioned by the CEO of Stardog, a fast-growing Enterprise Knowledge Graph Platform provider, to redesign their existing knowledge graph product that could be used not only by technical users but also business analysts who typically rely on IT to create a graph for them. We identified a need for a simpler data unification process. We collaborated closely with their product and engineering team on a mission to design various Graphical User Interfaces (GUIs) that would allow non-technical users to do data mapping, data modeling on their own without any coding.
Before
After

Why Use Visual Interface?
Current Stardog users are required to learn R2RML & SMS, a coding language, in order to create a Knowledge Graph for their organization. Junior Data Architects, Business Analysts, and Subject Matter Experts (SMEs) depend on the Data Engineers to set up and transform data into a useful knowledge graph and draw meaningful insights.
Objectives
Business Goal
To expand user groups to non-technical/business users who currently rely on engineers to make use of the product.
Project Goal
Redesign a knowledge graph platform in a way that allows non-technical users to prepare and create a knowledge graph on their own easily without relying on IT.
Background
1
What is a Knowledge Graph?
A knowledge graph is a graphical representation of all the data sources connected together (which was previously segregated) to transform information into useful knowledge to make an informed decision.
2
Project Scope
Creating a knowledge graph involves 4 major steps. As a v1 of the data unification tool redesign, we primarily focused on two core processes (data modeling and mapping).

3
Target Users
Our primary target users are less experienced technical staff (e.g., Junior Data Architect, Software Engineer., etc.) who have less than 5 years of experience because they will gain the most immediate benefit from the visual interface.
High-Techie
Ontologists, data architects (+5 years experience)
Current User
Low-Techie
Target User
Junior data architects (<5 years experience)
SMEs
Future User
Business Analysts (0 years experience)
4
Process
This project was divided into two phases. The first was the research phase which involved market research and contextual inquiries. The second was the design phase which involved prototyping and user testing.

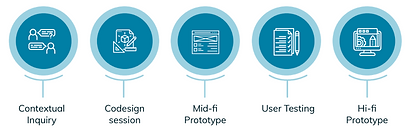
Research and Key Insights
Initially, we conducted market research to explore how other tools in the marketplace use GUI for knowledge graph creation. Later on, our team conducted 11 semi-structured interviews, 5 contextual inquiries + co-design sessions, and 5 mid-fi user testing to go deeper and understand the user’s pain points of the Stardog Studio's current interface and discuss possible solutions.


* Codesign Session
Insights
Design Implications
1. Modeling and mapping are very closely tied.
When users work on mapping, usually they need to edit/add new nodes or properties as needs arise.
Support seamless modeling experience while mapping. Each project will be treated as one virtual graph where users can create data models and do the mapping.
2. High-techies prefer coding.
They are more comfortable with writing codes rather than using a graphical interface.
Support the feature to switch between code view and visual view.
3. Auto-mapping is the default starting point for users.
The system auto-generates the data model and mapping for them which is editable.
Highlight Auto mapping feature when users first create the virtual graph project.
4. Users want to select some data before they start mapping.
They select a few fields that they need to work on before mapping to avoid being overwhelmed by the whole set of data.
Provide a feature that allows users to select the fields of their interest and then start mapping.
Research Deliverables
Our initial user research helped us understand an end-to-end process of creating a knowledge graph. Building a storyboard and workflow model allowed us to capture and communicate those main steps and discuss the project scope with key project stakeholders more efficiently.

* Storyboard

*Work Flow Model (Click to view in full-size)

Initial Design vs. Final Design
-
Creating and Opening a Virtual Graph Project + Auto Mapping: Start a new project or open existing projects. The auto-mapping feature automatically creates a data model and map the selected fields from the database.
-
Data modeling: Create classes and properties and add relationships between classes.
-
Data mapping: Connect the fields from the database to classes, properties, and relationships.
1. Creating a Virtual Graph project + Auto Mapping

2. Data Modeling

3. Data Mapping

Prototype Walkthrough


bottom of page